Intermittent Demand and Multiple Temporal Aggregation
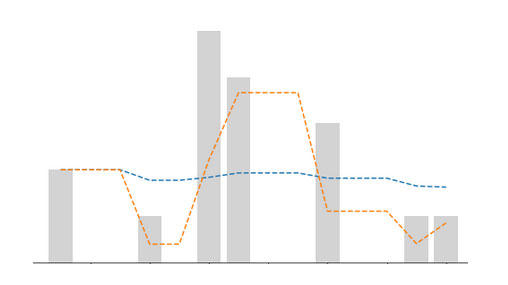
In the ADIDA tutorial we aggregated time series using different sized "time buckets". This allowed us to remove, or heavily reduce, intermittency within the data. We then made a prediction using this aggregated series and saw that different...
Continue Reading
Aggregate-Disaggregate Intermittent Demand Approach
In previous tutorials we've looked at Croston's Method and a few adaptations which all seek to handle intermittent demand. The Aggregate-Disaggregate Intermittent Demand Approach (ADIDA) aims to remove intermittence by reducing a series into...
Continue Reading
Used Car Price Model (Part 3) - Transformations and Linear Regression
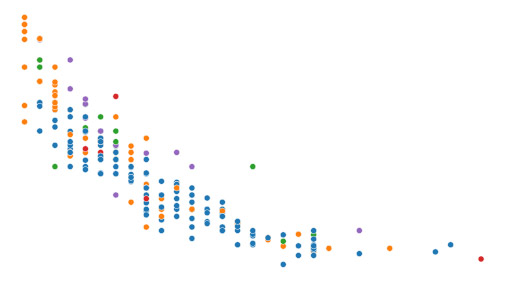
In the first two parts of this series, we scraped Toyota Corolla adverts from Gumtree and converted categorical features into numeric types. Before we finally fit our data to a linear model, we'll first look at whether we need to transform any of the features...
Continue Reading
Used Car Price Model (Part 2) - Cleaning and Feature Extraction
The satisfaction of cleaning a car is the same as cleaning a dataset. And who knows, one day in the future the guy at the traffic lights washing windscreens will be replaced by an out-of-work coder that will clean your dataset for 75 crypto-bucks...
Continue Reading
Used Car Price Model (Part 1) - Web Scraping
The Toyota Corolla is the vanilla bean of the icecream world - reliable, fuel efficient and fast enough to keep up with traffic. While it might not stir emtions of power and adrenaline, the car will make a good case study for a used-car price model...
Continue Reading
Least Squares Solution Using the Moore-Penrose Inverse
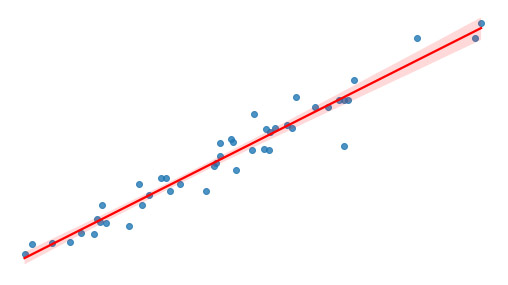
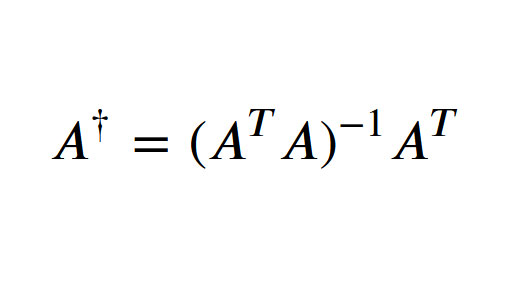
When finding the 'line of best fit' between one or more variables and a target, we often turn to our favourite linear regression package. If we're feeling adventurous, we might even write our own gradient descent algorithm. But we can also...
Continue Reading
Error Metrics for Intermittent Demand (CFE, PIS, MSR)
Intermittent demand is present in many retail settings and when forecasting stock requirements, businesses must strike a balance between the cost of goods and loss of sales due to a lack of stock. When training a forecasting model, using...
Continue Reading
Adaptations of Croston's Method
The Syntetos-Boylan Approximation and the Teunter-Syntetos-Babai method are two adaptations of Croston's method that attempt to improve forecasting accuracy. This tutorial will run through the procedure for both methods and...
Continue Reading
Croston's Method
Croston's method was developed to create forecasts for time series with intermittent demand. The method involves breaking down a series into two separate components. The first is the non-zero demand, which is the time series when all zero...
Continue Reading
Holt-Winters Method and Northam Temperature Data
Triple Exponential Smoothing, or the Holt-Winters method, is a forecasting technique that can capture both the underlying trend of a time series as well as a seasonal component. For example, a retail store may see consistently higher sales...
Continue Reading
Holt's Method and Marine CO2 Surface Levels
Double Exponential Smoothing, commonly known as Holt's method, is a forecasting model that tracks an underlying trend in a time series. It builds on the concepts laid out in the component form of Simple Exponential Smoothing. In this...
Continue Reading
SES and New Zealand GHG Emissions
In the first tutorial on Simple Exponential Smoothing, we explored two approaches to smoothing a time series. We'll now apply SES on a NZ Greenhouse Gas Emissions dataset, where we will see the effect of the smoothing paramater, alpha, on...
Continue Reading
Simple Exponential Smoothing
Simple Exponential Smoothing is similar to a moving-average, but instead of weighting each point equally, an exponential function dictates the weights assigned. Forecasts are more sensitive to recently observed values and less so to...
Continue Reading
Seasonal Naive Forecasting
The Naive model is extremely simple - take the last observed value and use this as the prediction. For such a basic model it can prove to be quite powerful. For example, here in Perth, we can forecast whether it is going to rain or not by using...
Continue Reading
WRMSSE for the M5 Dataset
Kaggle's M5 forecasting competition uses a weighted adaptation of the RMSSE as its measure of accuracy. This guide will establish why each series is weighted, how the WRMSSE is calculated, and a Python package for calculating....
Continue Reading
MAE, MAPE, MASE and the Scaled RMSE
The goal of any forecasting model is to produce an accurate prediction of the future, but how that accuracy is measured is important. We will review common accuracy metrics, such as the MAE and see their limitation when comparing data at...
Continue Reading